|
AP Statistics Chapter 7 – Random Variables
7.1: Discrete and Continuous Random Variables
RANDOM VARIABLE
A random variable is a variable whose value is a numerical outcome of a random phenomenon.
DISCRETE RANDOM VARIABLE
A discrete random variable X has a countable number of possible values. The probability distribution of X lists the values and their probabilities.
Value of X |
x1 |
x2 |
x3 |
… |
xk |
Probability |
p1 |
p2 |
p3 |
… |
pk |
The probabilities pi must satisfy two requirements:
1. Every probability pi is a number between 0 and 1.
2. p1 + p2 + … + pk = 1
Find the probability of any event by adding the probabilities pi of the particular values xi that make up the event.
CONTINUOUS RANDOM VARIABLE
A continuous random variable X takes all values in an interval of numbers. The probability distribution of X is described by a density curve. The probability of any event is the area under the density curve and above the values of X that make up the event.
7.2: Means and Variances of Random Variables
MEAN OF A DISCRETE RANDOM VARIABLE
Suppose that X is a discrete random variable whose distribution is
Value of X |
x1 |
x2 |
x3 |
… |
xk |
Probability |
p1 |
p2 |
p3 |
… |
pk |
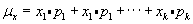
To find the mean of X, multiply each possible value by its probability, then add all the products:
STANDARD DEVIATION OF A DISCRETE RANDOM VARIABLE
Suppose that X is a discrete random variable whose distribution is
Value of X |
x1 |
x2 |
x3 |
… |
xk |
Probability |
p1 |
p2 |
p3 |
… |
pk |
and m is the mean of X. The variance of X is

and the standard deviation is the square root of the previous result.
LAW OF LARGE NUMBERS
Draw independent observations at random from any population with finite mean  . As the number of observations drawn increases, the mean of the observed values eventually approaches the mean . As the number of observations drawn increases, the mean of the observed values eventually approaches the mean  . .
|