Multiple Choice
Identify the
choice that best completes the statement or answers the question.
|
|
|
1.
|
For their uniforms, the Eagles soccer team has a choice of 4 different styles
for the shirts, 3 for the shorts and 3 colors of socks. How many different uniforms are
possible?
|
|
|
2.
|
How many ways are there to order 3 different items?
|
|
|
3.
|
Evaluate  a. | 36 | b. | 15,120 | c. | 84 | d. | 126 | e. | 3,024 |
|
|
|
4.
|
Evaluate  a. | 181,440 | b. | 9 | c. | 126 | d. | 72 | e. | 36 |
|
|
|
5.
|
How many ways are there to choose a president and a vice-president for a school
club that consists of 16 members?
a. | 250 | b. | 232 | c. | 236 | d. | 240 | e. | 238 |
|
|
|
6.
|
How many ways are there to choose two representatives for a school club that
consists of 13 members to participate in student council meetings?
|
|
|
At Paulo’s Pizza, pizzas are available in the following sizes and people
buy them with the given probabilities. Personal | Small | Medium | Large | .08 | .21 | .32 | .39 | | | | |
|
|
|
7.
|
What is the probability that someone orders a large or a medium
pizza?
a. | .47 | b. | .60 | c. | .53 | d. | .40 | e. | .71 |
|
|
|
8.
|
What is the probability that someone does not order a personal pizza?
a. | .79 | b. | .08 | c. | .92 | d. | .61 | e. | .68 |
|
|
|
9.
|
Assuming that pizza orders are independent, what is the probability that two
consecutive pizza orders are both for a large pizza?
a. | .006 | b. | .115 | c. | .152 | d. | .102 | e. | .044 |
|
|
|
You are going to play 4 games of ping-pong against your best friend. Based on
your past experience, you estimate that your probability of winning any single game is .64. It is to
be assumed that each game outcome is independent of all other games played.
|
|
|
10.
|
What is the probability that you win all of the games?
a. | .158 | b. | .188 | c. | .107 | d. | .262 | e. | .168 |
|
|
|
11.
|
What is the probability that you lose all of the games?
a. | .067 | b. | .057 | c. | .047 | d. | .017 | e. | .006 |
|
|
|
An art class consists of 10th, 11th and 12th grade students. A two-way table, by
gender, is given below for the makeup of this class. | | 10th grade | 11th grade | 12th grade | female | 4 | 8 | 6 | male | 5 | 7 | 7 | | | | |
|
|
|
12.
|
If a student from this class is chosen at random, what is the probability that
they are in 11th grade?
a. | .514 | b. | .486 | c. | .405 | d. | .351 | e. | .243 |
|
|
|
13.
|
If a student from this class is chosen at random, what is the probability that
they are male?
a. | .243 | b. | .405 | c. | .351 | d. | .486 | e. | .514 |
|
|
|
14.
|
If a student from this class is chosen at random, what is the probability that
they are a female 11th-grader?
a. | .189 | b. | .108 | c. | .216 | d. | .162 | e. | .135 |
|
|
|
15.
|
If a student from this class is chosen at random, what is the probability that
they are a female given that they are 10th-grader?
a. | .189 | b. | .135 | c. | .444 | d. | .108 | e. | .162 |
|
|
|
16.
|
If a student from this class is chosen at random, what is the probability that
they are a 11th-grader given that they are male?
a. | .216 | b. | .189 | c. | .162 | d. | .368 | e. | .135 |
|
|
|
A random sample of 58 adults were surveyed and asked whether they were married
and whether they had children. Let M = person is married and C = person has children. The Venn
diagram below summarizes their responses. 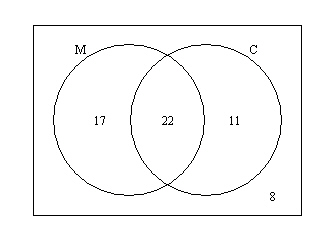
|
|
|
17.
|
If a person from this survey is chosen at random, what is the probability that
they are married?
a. | .379 | b. | .293 | c. | .522 | d. | .190 | e. | .672 |
|
|
|
18.
|
If a person from this survey is chosen at random, what is the probability that
they have children?
a. | .379 | b. | .293 | c. | .569 | d. | .419 | e. | .190 |
|
|
|
19.
|
If a person from this survey is chosen at random, what is the probability that
they have children given that they are married?
a. | .379 | b. | .414 | c. | .564 | d. | .293 | e. | .190 |
|
|
|
20.
|
If a person from this survey is chosen at random, what is the probability that
they are married given that they have children?
a. | .293 | b. | .517 | c. | .190 | d. | .379 | e. | .667 |
|