Multiple Choice
Identify the
choice that best completes the statement or answers the question.
|
|
|
1.
|
Suppose the following information was collected,
where X = diameter of tree trunk in inches, and Y = tree height in feet.
If the LSRL equation is y = –3.6
+ 3.1x, what is your estimate of the average height of all trees having a trunk diameter of 7
inches?
|
|
|
2.
|
A copy machine dealer has data on the number x of
copy machines at each of 89 customer locations and the number y of service calls in a month at each
location. Summary calculations give  = 8.4, Sx = 2.1, = 8.4, Sx = 2.1,  = 14.2,
Sy = 3.8, and r = 0.86. What is the slope of the least squares regression line of
number of service calls on number of copiers? = 14.2,
Sy = 3.8, and r = 0.86. What is the slope of the least squares regression line of
number of service calls on number of copiers?
a. | 0.86 | b. | 1.56 | c. | 0.48 | d. | None of
these |
|
|
|
3.
|
There is a linear relationship between the number
of chirps made by the striped ground cricket and the air temperature. A least squares fit of
some data collected by a biologist gives the model  = 25.2 +
3.3x, where x is the number of chirps per minute and = 25.2 +
3.3x, where x is the number of chirps per minute and  is the
estimated temperature in degrees Fahrenheit. What is the estimated increase in temperature that
corresponds to an increase in 1 chirp per minute? is the
estimated temperature in degrees Fahrenheit. What is the estimated increase in temperature that
corresponds to an increase in 1 chirp per minute?
a. | 1.0 °F | b. | 3.3 °F | c. | 25.2
°F | d. | 28.5 °F |
|
|
|
4.
|
A set of data relates the amount of annual salary
raise and the performance rating. The least squares regression equation is  = 1,400 +
2,000x where y is the estimated raise and x is the performance rating. Which
of the following statements is not correct? = 1,400 +
2,000x where y is the estimated raise and x is the performance rating. Which
of the following statements is not correct?
a. | The expected salary for a performance rating of 0 is
$1,400. | b. | For each increase of one point in performance rating,
the raise will increase on average by $2,000. | c. | The correlation
for of these two variables is positive. | d. | All of the above
are true. |
|
|
|
5.
|
Below is a scatterplot of the calories and sodium
content (in milligrams) of several brands of meat hot dogs. The least-squares regression line has
been drawn on the plot.
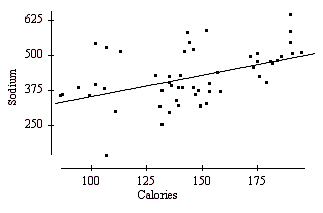
Based on the least-squares
regression line in this scatterplot, one would predict that a hot dog containing 100 calories would
have a sodium content (in milligrams) of about
|
|
|
Scenario 3-3
Consider the following scatterplot, which describes
the relationship between stopping distance (in feet) and air temperature (in degrees Centigrade) for
a certain 2,000-pound car travelling 40 mph. 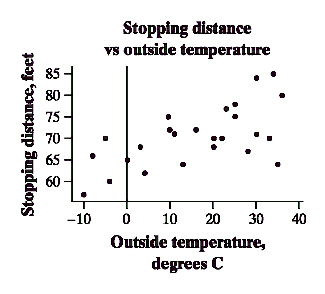
|
|
|
6.
|
Use Scenario 3-3. The correlation between temperature and stopping
distance
a. | is approximately 0.9. | b. | is approximately 0.6. | c. | is approximately
0.0. | d. | is approximately -0.6. |
|
|
|
7.
|
Which of the following has a correlation that is closest to 0?
|
|
|
8.
|
Which of the following is NOT true about the correlation coefficient
r?
a. |  | b. | When the slope of
the data is negative, the correlation r will be negative | c. | Whenever all the
data lie on a perfectly straight line, the correlation r will always be equal to
+1.0 | d. | Correlation is greatly affected by outliers |
|
|
|
The table below shows the temperature of a pot of water as it is being heated on
a stove. | Time (min),
x | 1 | 2 | 3 | 4 | 5 | | Temp (ºF), y | 76 | 80 | 84 | 88 | 92 | | | | | | |
|
|
|
9.
|
What is the predicted temperature of the water after 8 minutes?
|
|
|
10.
|
What was the temperature of the water before it was heated?
|