Multiple Choice
Identify the
choice that best completes the statement or answers the question.
|
|
|
1.
|
Which of the following are true
statements?
I. High correlation does not necessarily imply
causation.
II. A lurking variable is
a name given to variables that cannot be identified or explained.
III. Successful prediction requires a cause and effect
relationship.
a. | I only | b. | II only | c. | III
only | d. | I and III only | e. | None of the above |
|
|
|
2.
|
There is a positive association between the number
of drownings and ice cream sales. This is an example of an association likely caused
by:
a. | Coincidence | b. | Cause and effect relationship | c. | Confounding factor | d. | Common response
| e. | None of the above |
|
|
|
3.
|
Which of the following would provide evidence that
a power law model describes the relationship between a response y and an explanatory variable
x?
a. | A scatterplot of y versus x looks
approximately linear. | b. | A scatterplot of
log y versus x looks approximately linear. | c. | A scatterplot of y versus log x looks approximately
linear. | d. | A scatterplot of log y versus log x looks
approximately linear. |
|
|
|
4.
|
A scatterplot of a response variable Y
versus an explanatory variable X is given below.
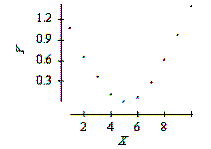
Which of the following is true?
a. | There is a nonlinear relationship between Y and
X. | b. | There is a very strong positive correlation between
Y and X because there is an obvious relation between these
variables. | c. | There is a linear
relation between Y and X. | d. | All of the
above. |
|
|
|
5.
|
A researcher computed the average Math SAT score of
all high school seniors who took the SAT exam for each of the 50 states. The researcher also computed
the average salary of high school teachers in each of these states and plotted these average salaries
against the average Math SAT scores. The plot showed a distinct negative association between average
Math SAT scores and teacher salaries. A second researcher conducted a similar study, but computed the
average Math SAT score for each school district in the nation and plotted these against the average
salary of high school teachers in the district. The association between average Math SAT score and
average teacher salaries in the plot of the second researcher will most likely be
a. | about the same as the association seen by the first
researcher. | b. | much stronger than
that seen by the first researcher. | c. | much stronger than
that seen by the first researcher, but with the opposite sign. | d. | weaker than that seen by the first
researcher. |
|
|
|
6.
|
When possible, the best way to establish that an
observed association is the result of a cause-and-effect relation is by means of
a. | the least-squares regression
line. | b. | the correlation coefficient. | c. | examining z-scores rather than the original
variables. | d. | a well-designed
experiment. |
|
|
|
7.
|
The two-way table below categorizes suicides
committed in 1983 by the sex of the victim and the method used.
| Method | Male | Female | | Firearms | 13,
959 | 2,641 | | Poison | 3,148 | 2,469 | | Hanging | 3,222 | 709 | | Other | 1,457 | 690 | | | |
Which of the following statements is
consistent with the table?
a. | There is absolutely no evidence of a relation between
the sex of the victim and the method of suicide used. | b. | More women commit suicide than men. | c. | Men display a greater tendency to use firearms to commit suicide than do
women. | d. | The correlation between method of suicide and sex of the
victim is clearly positive. |
|
|
|
8.
|
In a study of the link between high blood pressure
and cardiovascular disease, a group of white males ages 35 to 64 was followed for five years. At the
beginning of the study, each man had his blood pressure measured; the blood pressure was classified
as either “low” systolic blood pressure (less than 140 mmHg) or “high” blood
pressure (140 mmHg or higher). The following table gives the number of men in each blood pressure
category and the number of deaths from cardiovascular disease during the five-year
period.
Blood Pressure | Deaths | Total | Low | 10 | 2000 | High | 50 | 3500 | | | |
Based on the data given here, which of the following statements is
correct?
a. | These data are consistent with the idea that there is a
link between high blood pressure and death from cardiovascular disease. | b. | The mortality rate (proportion of deaths) for men with high blood pressure is
five times that of men with low blood pressure. | c. | These data
probably understate the link between high blood pressure and death from cardiovascular disease, since
men will tend to understate their true blood pressure. | d. | All of the above. |
|
|
|
9.
|
X and Y are two categorical
variables. The best way to determine whether there is a relation between them is to
a. | calculate the correlation between X and
Y. | b. | draw a scatterplot of the X and Y
values. | c. | make a two-way table of the X and Y
values. | d. | do all of the
above. |
|
|
|
10.
|
A review of voter registration records in a small
town yielded the following table of the number of males and females registered as Democrat,
Republican, or some other affiliation.
| | Male | Female | | Democrat | 300 | 600 | | Republican | 500 | 300 | | Other | 200 | 100
| | | |
The proportion of registered Democrats
who are male is
a. | 300. | c. | 0.30. | b. | 0.33. | d. | 0.15. |
|